How to interpret and use the SharePoint export data?
When a SharePoint integration is configured, a data export will run daily. The resulting excel file is uploaded to the configured SharePoint folder.
The exported excel file consists of several tabs with data:
Let’s address how this data should be interpreted.
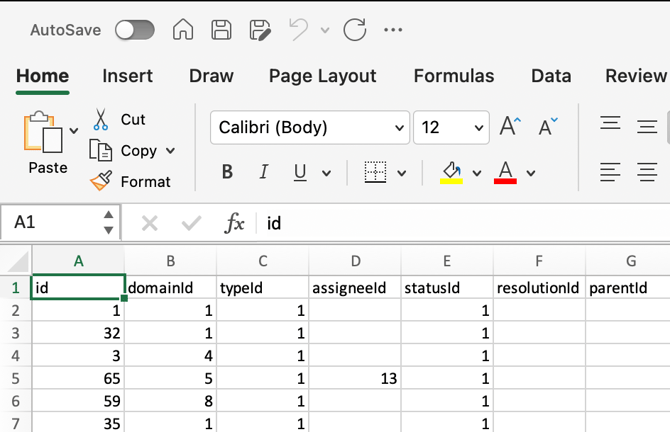
Let’s take the tab Issues.
Each row (Issue) has an unique id.
Next to that, the ids of corresponding attributes (Domain, type, assignee, etc.) are given.
Example: Find the domain for an issue
The Issue with id 1 has the attribute domainId 1;
If we look in the tab Domains, we see the row with the id 1 has the name Compliance.
Example: Find the resolution for a report
This requires a few more steps. Start by opening the tab Reports.
Let’s take the report with the id 152. Note the issueId 82.
Now open the tab Issues and find the one with the id 82.
Find the resolutionId (1) and go to the tab Issue Resolutions and find the resolution with id 1.
The matching resolution is “Test case“
Integration
Software, such as PowerBi, can be set up to use the data export and link the data together as described above.
